The Current Weather – Creating the Initial Conditions
Based on the recipe for making a forecast articulated by Abbe, Bjerknes, and Richardson, we can create a weather and air-quality forecast on our computers at the University of Manchester. The recipe requires two things: the current state of the atmosphere and the laws of physics.
Here, we consider the current weather conditions (i.e., the state of the atmosphere) at t=0 in the model forecast. We also call these the initial conditions. We need to know what the weather is now in order to predict it in the future.
So, how do we know what the current weather is? We take observations. The observations come from all over the world and include the following.
Surface observations on land and on the water
Weather stations on the ground and on the water measure the conditions in the atmosphere near the ground. These often occur on land at airports and other observing locations. Over the water, ships, moored buoys, and drifting buoys provide weather data. Because 75% of the Earth is covered by water, these observations are especially important. Although surface observations are dense where people live, a lot of areas in the Southern Hemisphere and over the ocean are left observation free. Thus, there may be gaps in how much we know about the weather over these data-sparse locations. At any time, there are about 70,000 surface stations collecting observations that end up in global weather forecast models.
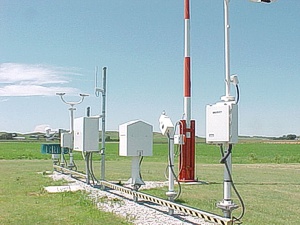
(Image source:
http://www.weather.gov/rah/virtualtourasos.)
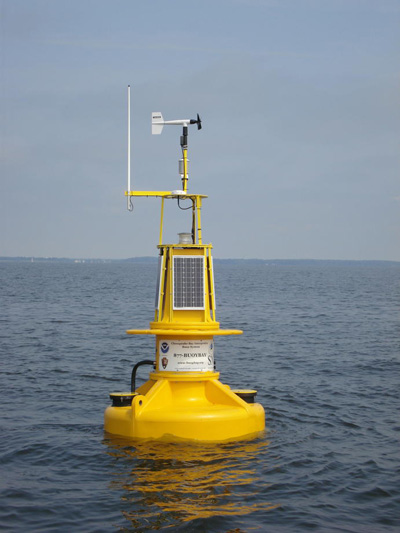
(Image source:
http://upload.wikimedia.org/wikipedia/commons/9/91/NOAA-smartbuoy2.jpg.)
Data from buoys around the world can be obtained from the National Data Buoy Center. http://www.ndbc.noaa.gov/
(Image credits: European Centre for Medium-Range Weather Forecasts.)
To see the latest surface station availability, visit https://charts.ecmwf.int/catalogue/packages/monitoring/products/dcover/.
Upper-air observations
Knowing about the current weather conditions goes beyond just knowing what is happening at the surface. The majority of the atmosphere (about 88%) lies below 15 km in altitude, and what is happening at these heights can influence the weather at the surface quite dramatically. So, knowing the pressure, moisture content, temperature, and wind aloft is necessary to produce the initial conditions needed for forecast models. These upper-air observations come from a number of different data sources.
Radiosondes – Weather balloons are released into the atmosphere, filled with helium or hydrogen and attached to a box of meteorological instruments inside. The instruments measure the temperature, pressure, humidity, and moisture as the balloon rises in the atmosphere, all the while sending the data back to a surface station for analysis. When the balloon reaches about 20 km or higher, it pops and the instrument package falls to earth via parachute. About 1500 radiosondes are launched every day around the world.
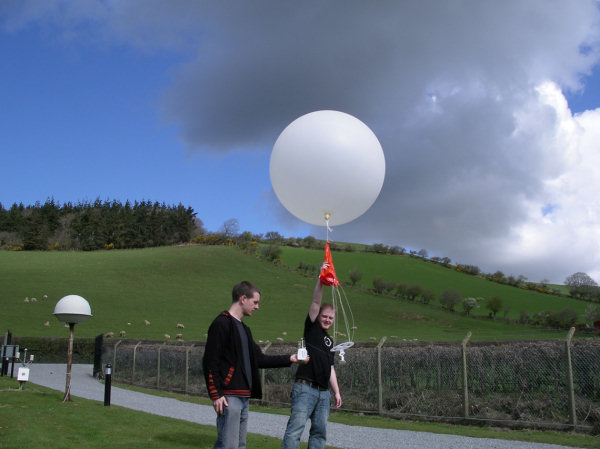
(Image Source: http://www.cas.manchester.ac.uk/resactivities/dynamicsandremotesensing/.)
To see the variety of different radiosondes over time, visit the radiosondemuseum.
Pibal balloons – Pibals (or "pilot ballons") are weather balloons without the instrument packages. They are launched where only the wind profile is needed (such as for aviation purposes). The balloon is tracked from the ground with a theodolite, radar or GPS. About 250 pibals are collected for the initial conditions of global forecast models.
Aircraft – Over a hundred thousand commercial aircraft flights happen every day around the world. Most aircraft carry equipment that takes continuous measurements while in flight. The observations tend to be taken at an altitude of 30,000–35,000 feet (about 9–10.5 km), which is where the jet stream is. Observations are taken every second and are radioed back to the ground. As most aircraft fly within fixed flight routes, a lot of data comes from concentrated zones. As a result, over 100,000 observations from aircraft are collected for the initial conditions.
Radar wind profilers – Radar wind profilers emit beams of microwave radiation that measure the direction and speed of the wind with height. About 1600 wind profilers operate around the world.
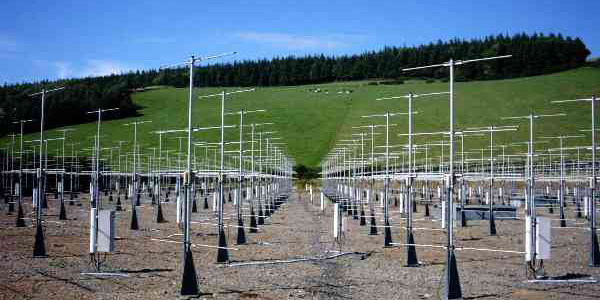
(Image Source: http://www.cas.manchester.ac.uk/resactivities/dynamicsandremotesensing/.)
Satellite observations – By far the most abundant source of data that goes into global weather forecasts are data from satellites. Over 3 million observations are collected to help create the initial conditions. Satellites orbit the Earth from space and continuously measure the radiation emitted by the Earth (passive measurements) or, like radar, emit radiation to measure winds, clouds, and precipitation (active measurements). Passive measurements can be made with visible light (such as for the figure below) or infrared radiation. Satellites can orbit the Earth in a polar orbit (polar-orbitting satellite) or above a fixed point on the equator (geostationary satellite). Satellite images that you see on television weather forecasts are from geostationary satellites.
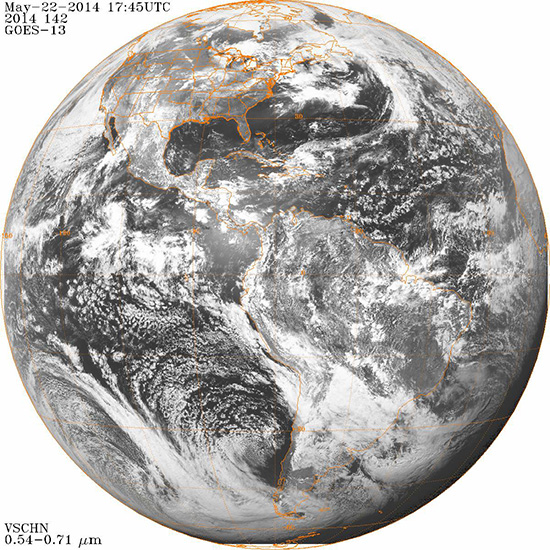
(Image source: http://www.ncdc.noaa.gov/gibbs/image/GOE-13/VS/2014-05-22-18.)
(Image credits: National Oceanic and Atmospheric Administration, http://www.ncdc.noaa.gov/gibbs/).
Creating a Grid of Weather Data
All these data being collected across the globe, both at the surface and aloft, arrive at national meteorological centers, such as the National Weather Service in the United States, the Met Office in the United Kingdom, and the European Centre for Medium-Range Weather Forecasts. The data are of different quantities (temperature, winds, moisture, etc.), and they are collected at irregular locations and different times across the globe.
To perform the calculations in the computer model, however, the data must reside on a regularly spaced grid at a single time. How then do these gridded initial conditions needed for the forecast get produced? The answer lies in a process called data assimilation.
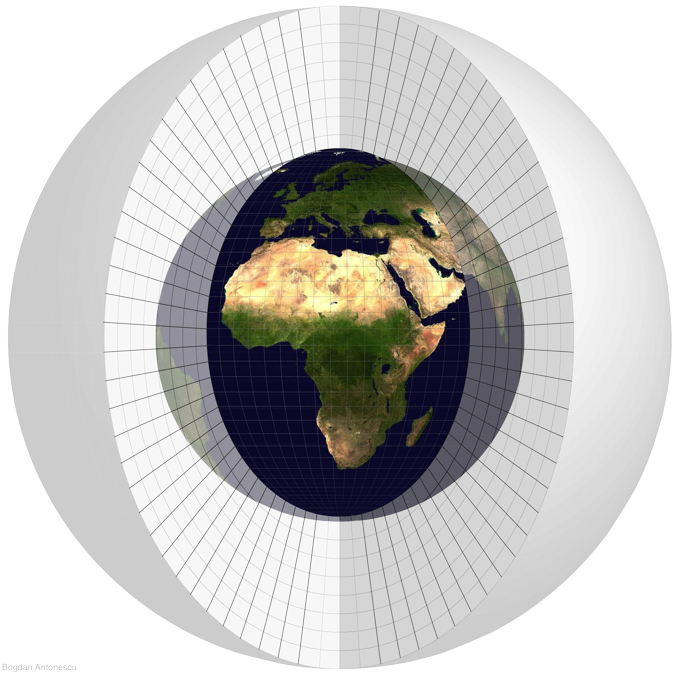
(Image courtesy of Bogdan Antonescu, University of Manchester.)
Data assimilation is a mathematical process by which different datasets collected at irregularly-occurring locations and at irregular times get synthesized into a regularly-spaced grid that is consistent with the equations that describe the physics of the atmosphere. Making the data consistent with the equations is important because small-scale features that would be unresolved in the model representation of the atmosphere can be eliminated from the initial conditions. This process helps to keep the model running smoothly. It is also the reason that Lewis Fry Richardson's forecast ended badly: the input data Richardson used was not in harmony with the laws of physics, resulting in large responses when the atmosphere tried to get back toward "balance" (Lynch 1992, 2006).
How Does ManUniCast Get Its Initial Conditions?
Like all computer forecasting systems, ManUniCast needs initial conditions to create forecasts. Instead of collecting all the observations and performing the time-consuming process of data assimilation, ManUniCast skips this step by using gridded analyses from the Global Forecasting System (GFS), which is the global forecasting model of the National Weather Service of the United States. This gridded data is then used as the starting point for the initial conditions of ManUniCast.
Because it takes time for the National Weather Service to receive the observations from across the globe, perform the data assimilation, and make the data freely available on the internet, we start the model at 0005 UTC, five minutes after midnight, using initial conditions from 6 hours earlier (1800 UTC). Because the gridded analyses of the GFS are coarser than the grid spacing for ManUniCast, ManUniCast takes a few hours to develop fine-scale structures on the scale of the gridded analyses, called model spin-up. Starting forecast models with coarsely gridded data from another model and no data assimilation is referred to as giving the model a cold start. It can be an effective way to get a forecast model going in a computationally inexpensive way. But, it produces forecasts that may be less than ideal because the latest data are not being accounted for through data assimilation.
For More Information
Inness, Peter Michael, and Steve Dorling, 2013: Operational Weather Forecasting. Wiley, 248 pp. [Link]
Lynch, Peter, 1992: Richardson's Barotropic Forecast: A Reappraisal. Bull. Amer. Meteor. Soc., 73, 35–47.
doi: http://dx.doi.org/10.1175/1520-0477(1992)073<0035:RBFAR>2.0.CO;2
Lynch, Peter, 2006: The Emergence of Numerical Weather Prediction: Richardson's Dream. Cambridge University Press, 279 pp. [Link]
Warner, Thomas Tomkins, 2011: Numerical Weather and Climate Prediction. Cambridge University Press, 526 pp.
These pages are written for ManUniCast by David Schultz, Fiona Lomas, and Katy Mulqueen, University of Manchester. Photos and graphics are credited individually.